“Data-Driven Thinking” is written by members of the media community and contains fresh ideas on the digital revolution in media.
Today’s column is written by Marc Grabowski, chief operating officer at Nanigans.
Attribution helps measure the events impacting a business, but it is much more important than measurement alone.
An accurate attribution picture should allow an advertiser to place greater value on events that truly impact revenue. It enables higher bids in a programmatic marketplace, leading to a higher winning percentage in auctions. This is particularly important in times of inventory constraints, such as the upcoming holiday shopping season.
Given this, there is one question you should ask about attribution: Which events are driving revenue?
The answer lies in a properly executed experiment design, defined here as an information gathering process to help advertisers determine the best attribution models to increase their revenues.
In my last column, we surfaced some of the more universally accepted attribution models. Now let’s dive into the details of developing a successful experiment design.

1. Determine which actions matter
Determining the weighted value of actions requires A/B testing and the use of holdout groups. Experiment design is an area of vastly differing opinions, but starts with figuring out exactly what you would like to test.
Is your aim to learn the value of a channel in your predetermined attribution model? Are you trying to learn which single event drove a sale? Do you want to understand the value of several events in a conversion path?

Once you determine the goal of your experiment, you must gauge the lift of independent channels. There are many philosophies around the most scientific experiment designs, but most of them have a few practices in common.
2. Create a clean and unexposed group
Depending on your planning and sales cycles, an advertiser should “starve” an audience for at least one month before running a campaign. This is often referred to as a “flush-out” period.
Create a holdout group within a specific channel, such as a publisher or exchange, which will not receive any of your ads for a given period. This group should be representative of your target audience. You will advertise to half of this audience when your test launches. As a result, you will better understand the impact of “first exposure” in an upcoming test.
Your publishing partners also should build a representative holdout group and suppress ads to that group during the flush-out period.
Choose a representative sample of the potential audience for that publisher or channel, but don’t suppress all ads for the sample. Ten percent of the ultimate audience is most often used for flush-out periods.
During Testing
1. The exposed group
An exposed group of users will receive your ads and messaging.
2. The control group
A control group must be used to establish baseline performance for users who do not see your brand’s ad or offer. A public service announcement (PSA) is often served to these users that enables conversion tracking tied to this ad-rendering event. Your publishing partner must create a holdout group to avoid overlap between control and exposed audiences.
3. Pixels
View–and-click pixels must be attached to the creative.
Additionally, pixels throughout the conversion path on your website should be placed to track causation of downstream events.
The test should track all activity that arises after the ad is rendered. Normally you will register some conversions attached to the PSA. It is normally assumed that these would have occurred regardless of an ad being shown.
The difference between the conversion rate for the PSA and your brand or offer ad is defined as the “lift.”
Measuring Two Types Of Lift
It is important to track and measure two types of lift. The first, called direct lift, is the measurement of an ad that leads directly to a purchase-conversion event.
The second, called indirect lift, is the measurement of an ad that leads to a retargeting event, which in turn results in a purchase.
This experiment design does not immediately dictate your attribution model but will help you determine if the channel has provided lift over a baseline. If there is not a profitable lift, there are very few reasons to continue to the attribution modeling phase.
Attribution Modeling
After running the baseline lift model, the advertiser needs to analyze all of the touch points prior to a conversion event. To reiterate, the analysis must track back to the intent of the test and not attempt to solve all attribution problems at one time.
There are a number of interpretations for test results but normally advertisers will look at the entire click path of converted users as compared to users who did not convert.
Isolate Each Event
Conduct a regression analysis against events preceding a conversion and try to answer two questions:
1. What happens if I remove a single event from the chain?
Do conversions increase, decrease or stay flat? This can be rephrased to ask, “What happens if one event is not present in the chain?”
2. Which events are linked?
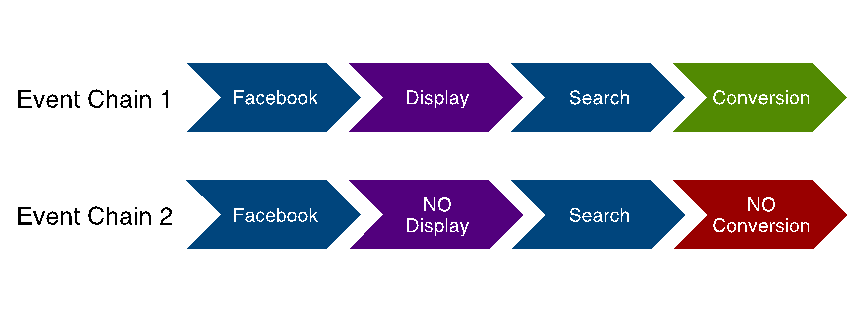
If both paths in Figure 1 below exist, you must examine the entire click path and not only the paid advertising events.
Understanding Direct Vs. Indirect Conversions
There is a display advertising event in the conversion path in Figure 1 below. Many marketers examine “direct conversion-influencing events,” and in this case, one could wrongly assume that the display event in the first event chain was solely responsible for the conversion.
Figure 1
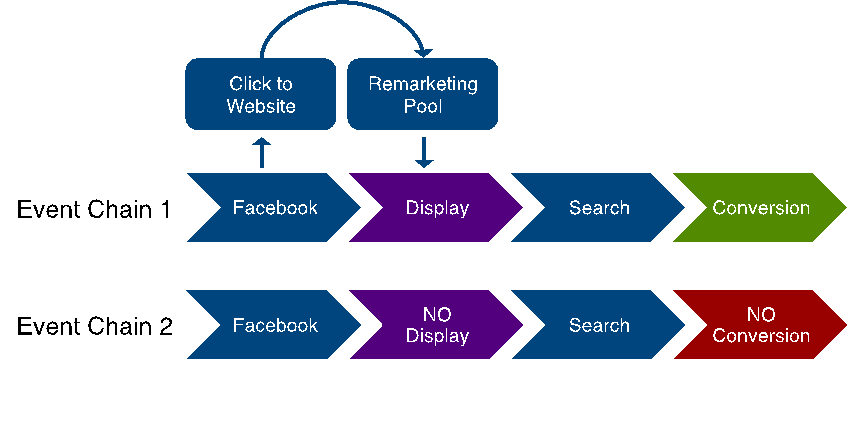
However, in event chain 1 in Figure 2 below, we see that the display ad event actually resulted from a Facebook ad being clicked, placing that person in a remarketing pool. In this case, it is fair to say that the Facebook ad impression was at least as responsible for the conversion as the display event.
Those who are focused on demand generation vs. demand fulfillment would argue that Facebook was even more important than display in the chain. In this case, we would say that the Facebook ad was the “indirect conversion-influencing event.”
Figure 2
At the end of the day, no matter how you model your attribution, it is critical to think through your experiment design to answer the question: “Which events are driving revenue?”
Keys To Success
Here are three tips for a successful experiment design:
1. Complexities will undoubtedly arise, so keep the experiment as simple as possible.
2. Understand which events you want to drive. A binary attribution model will differ greatly from a lifetime value model.
3. Examine all paid and unpaid events to determine whether indirect conversion-influencing events that may be present in your conversion chain.
Follow Marc Grabowski (@MarcTGrabowski) and AdExchanger (@adexchanger) on Twitter.