 Google revealed on Wednesday key insight on how consumers see ads online, pooling data from its advertising platforms over June and July.
The company compiled the results in a study called “The Importance of Being Seen: Viewability Insights for Digital Marketers and Publishers.” Get the PDF here.
“We’ve had Active View available on the Google Display Network for about a year and the ability to measure viewability in DoubleClick for about six months,” said Google group product manager Sanaz Ahari. “So we now have enough data to get a snapshot of viewability across the web and be confident that it’d be accurate.”
Defined by the Media Rating Council, a display ad is viewable when 50% of its pixels appear on screen for at least one second. In the study, Google described ad viewability rates, or the percentage of ads that are considered viewable out of the total number of ads measured. Google did not disclose this total number.
Google’s data puts the average publisher viewability rate at 50.2%.
“All data is aggregate so we didn’t break out what specific publishers fell in that group,” said Ahari. “These figures are meant to serve a benchmark that advertisers and publishers can use to evaluate viewability rates.”
This data, Ahari said, is a benchmark – the first time Google has scrutinized publishers in this way. He added that over time, Google will look at changing trends around viewability as publishers invest in more technology.
In total, 56.1% of ads weren’t seen at all, a figure that didn’t surprise Neil Sweeney, president and CEO of JUICE Mobile.
“Viewability and fraud are the two biggest issues of 2014,” Sweeney said. “And the reaction from the publishing side to these figures should be that they need to get on top of viewability and correct it.”

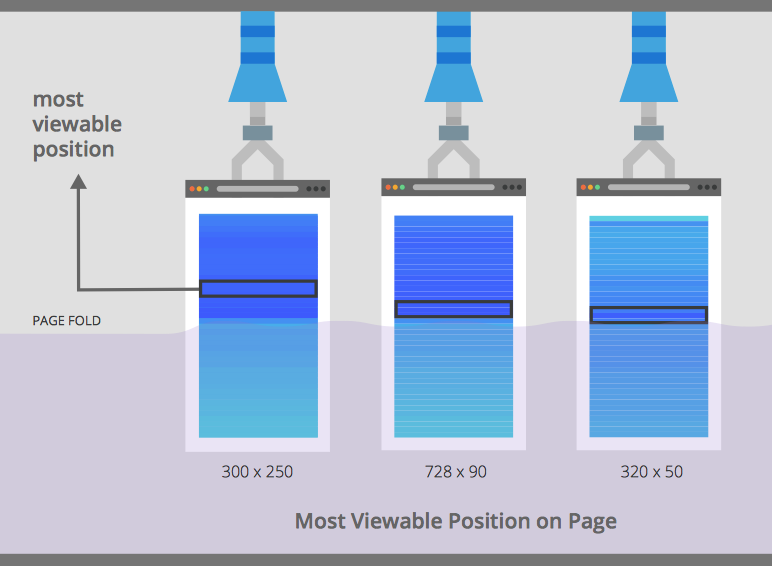
Additionally, above-the-fold ads are only 68% viewable, and below-the-fold ads are 40% viewable. Ads placed directly above the fold, as opposed to at the top of the page, scored a higher viewability rate.
“There’s a premium associated with being above the fold or below the fold,” added Sweeney. “But the question is if when a publisher sells ads, are they delineating between those two? And are they actually charging a difference between those two? It’s going to be different for every publisher.”
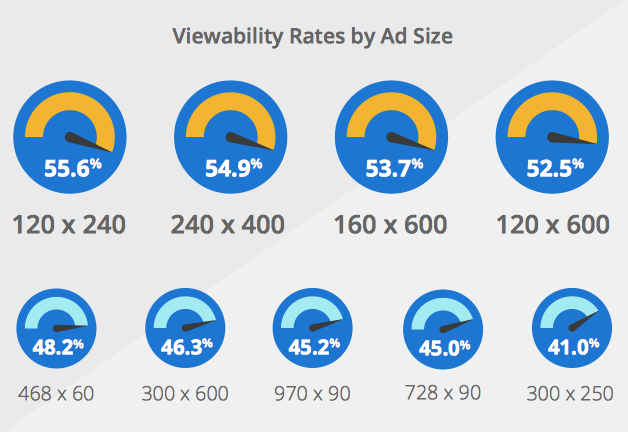
Google’s data also suggests that viewability increases with ad unit size and that vertical ad units are more viewable than horizontal formats, because they stay on a page longer as a user scrolls.
As a final finding, Google’s data suggests that viewability rates differ from one industry to the next. The data associates higher viewability rates with verticals or content that holds a user’s attention. Reference sites, for instance, scored a 51.9% rate of viewability, whereas Internet and telecom sites scored a 46.4% rate of viewability.
It remains to be seen how these finding affect publishers and advertisers. For instance, if page position and ad size matter, will advertisers pay more for placement right above the fold than at the top of the page? Will ad pricing change depending on differing viewability rates within each industry?
“I’m not going to speculate, but generally it’s fair to say that one of the main effects of viewability measurements is that it may cause advertisers and publishers to value inventory differently,” said Ahari. “This report is really only designed to look at viewability, not engagement, but anecdotally it makes sense that the more time someone spends with the content, the more likely ads are to come into viewability range.”