Despite some volatility in ad pricing and performance last quarter, Adobe Index’s Q1 2014 Social Media Intelligence Report indicates Facebook remains the leader in driving revenue per visit (RPV). Meanwhile other platforms – namely Twitter, Tumblr and Pinterest – are in some instances noticing quarterly double-digit declines in RPV.
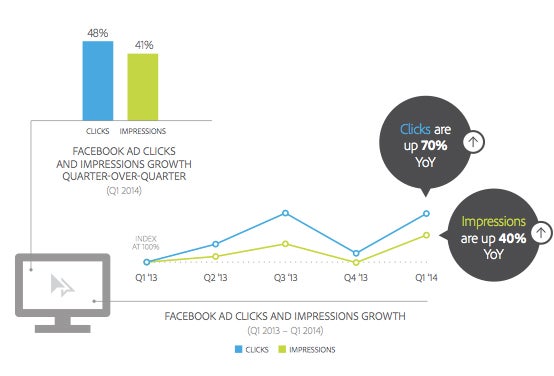
In paid social, Facebook saw a 160% increase in click-through-rates (CTR) year-over-year while its cost-per-click fell 2%. Impressions were up 40% year-over-year, outpaced by 30 percentage points in ad click volume.
“When we reported figures in Q3, [CTRs were up] about 300%, which obviously was a huge influx, and of course it has slowed down some, but still showing good growth,” said Joe Martin, senior analyst for Adobe Digital Index. “We also saw cost per click rates drop after the holidays. Less competition makes it a little bit cheaper than Q4.”


Not surprisingly, as marketers see further declines in organic reach for text-based posts, they’re turning to rich media. Facebook’s introduction of video auto-play in Q4 has appeared to drive more engagement despite initial backlash over their perceived invasiveness. Video plays are up 134% quarter-over-quarter. This, according to Martin, was one of the most surprising findings that resulted from the study.
“It appears to be doing exactly what Facebook wanted it to,” Martin said. “It’s creating higher engagement, and so we’ll see if that continues into Q2, but there was a 58% increase in engagement [for brand posts with embedded video] quarter-over-quarter so it seems like it did work.”
Another strength for Facebook in Q1 was in the area of referral traffic, with Facebook-referred RPV increasing 11% year-over-year and 2% quarter-over-quarter.
Conversely, Twitter-referred RPV was up 5% year-over-year and down 23% quarter-over-quarter; Tumblr was up 55% year-over-year, but markedly down 36% quarter-over-quarter. This shows that despite their performance year-over-year, no other social platforms besides Facebook have been able to provide consistent referred revenue gains aside from the holiday shopping season, the Index advised.

Additionally, there are serious questions about Pinterest’s monetization strategy, which come to light as a result of the Adobe study. Although Pinterest-referred traffic to retail sites is up 59% year-over year, it is down 56% quarter-over-quarter, indicating yet again that post-holiday slump consistent with the other social platforms.
It’s important to point out that although the quarterly drops seem profound, only about 2% of overall retail site traffic is derived from social to begin with.
Nonetheless, “you see that with that accountability [offered by platforms with ads APIs], brands are consistently investing in Facebook and Twitter and then are more-so ramping up in Q3 and Q4 with Tumblr and Pinterest,” Martin said.
“Pinterest Promoted Pins are still in beta tests with brand retailers, while they’re more focused on (user) growth,” he added. “Until they actually do have that ad revenue coming in, I don’t think they’ll be as accountable as Facebook and Twitter. We really only have (Pinterest) referral traffic because that’s captured by their internal clients. But, with Facebook, we know they constantly make changes and a lot of those are focused on targeting and are resulting in higher RPVs, and engagement.”
Adobe bases its Digital Index off of an anonymous sampling of data from 5,000 Adobe Marketing Cloud (specific products include Adobe Social, Media Optimizer and Adobe Analytics) clients. The analysis represents paid, earned and owned social media data points based on 260 billion Facebook ad impressions, 17 billion visits from referred sites and 226 billion Facebook post impressions.