 There is a common view that a big chunk of real time bidding activity consists of advertisers competing with themselves to win impression auctions. Not so, according to a new RTB report based on data gathered through Casale Media‘s sell-side Index Platform.
“There are a lot of shared brands, and also a lot of retargeting,” Casale Media VP Strategy Andrew Casale tells AdExchanger. “If you combine those scenarios you get the myth that most of the bid density is someone bidding against themselves. But bid platforms are very unique in the way they bid. It’s not just 12 auto brands bidding, or 12 travel brands. When bid activity is dense, it’s also dense from a category diversity perspective.”
The finding is just one facet of Casale Media’s new Index Quarterly Report (download), which examines Q1 and Q2 bid activity across a number of exchanges in North America. It’s a compelling read for anyone closely following the RTB space.
Here are a few other key findings:

Brand Behavior
Total RTB impressions on the Index Platform increased 28% between the first and second quarters of 2012. More striking, the number of brands and campaigns grew significantly between Q1 and Q2, owing to a combination of factors including cyclical sluggishness in the first quarter and a progressive surge in marketer investment in RTB. (One possible distorting factor is growth in Casale Media’s nascent RTB platform, but Andrew Casale dismisses that aspect: “The demand we see isn’t young. We work with every desk and every DSP. We are seeing the entire fire hose of demand.”)
Among all bidders, national brands owned 57% of RTB impressions in Q2, followed by Internet brands (29%), major regional brands (11%) and local business (3%). These ratios were fairly consistent from Q1 to Q2.
Viewed vertical by vertical, telecom was the leader in RTB market share throughout the year’s first half, with 11.3% in Q1 growing to 14.3% in Q2. Auto, computers, travel, and retail also ranked highly with more than 5% market share in both quarters. When you break it down in terms of willingness to spend, alcohol (#1 in both Q1 and Q2), travel, and auto were among the sectors willing to pay the most to win impressions.
DSP Trends
Marketwide, brands are not consistent in how they divide their RTB activity among DSPs. Some have a clear “preferred” DSP, while others divide spend between many bidding partners. The below chart shows five different (and not necessarily representative) brands.

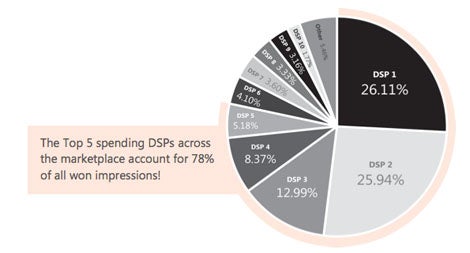
There are two obviously dominant DSPs, with approximately 25% market share each. The remaining 50% of victorious auctions are divided among eight-plus DSPs. The below pie chart shows the spread of “won impressions” among all demand side platforms bidding across exchanges in Casale Media’s Index Platform.
Transparency Wins
Casale Media finds websites that are not transparent about selling inventory in exchange environments generated only 56% of the bid density of websites that identify the publisher source and context. That finding indicates publishers that cloak their brand over wariness about cannibalizing sales are not able to fully leverage the benefits of RTB. It’s a Catch-22 for premium media sellers.
Meanwhile pricing trends continue to be fairly erratic. Casale recorded a significant drop in highest price paid, but average CPM increased 7.8% from Q1 to Q2. Lowest price paid also increased slightly, as shown in the chart below.

For publishers, one unfortunate conclusion of the report is that price consistency is probably not on the near-term horizon.
Casale said, “To have the same impression valued by 12 platforms at a [significant] spread, these markets have a ways to go before price discovery can really balance supply and demand, before there’s more consistency. It also potentially creates the case for opaque exchanges to become transparent.”
With more transparent marketplaces, he said, “You’d probably have a scenario where supply and demand get a little closer in alignment and value rises as it should.”